The Intel SSD DC P3700 Review Part 2: NVMe on Client Workloads
by Anand Lal Shimpi on June 10, 2014 12:07 AM EST- Posted in
- Storage
- SSDs
- Intel
- Intel SSD DC P3700
- NVMe
AnandTech Storage Bench 2013
Our Storage Bench 2013 focuses on worst-case multitasking and IO consistency. Similar to our earlier Storage Benches, the test is still application trace based—we record all IO requests made to a test system and play them back on the drive we're testing and run statistical analysis on the drive's responses. There are 49.8 million IO operations in total with 1583.0GB of reads and 875.6GB of writes. I'm not including the full description of the test for better readability, so make sure to read our Storage Bench 2013 introduction for the full details.
| AnandTech Storage Bench 2013 - The Destroyer | ||
| Workload | Description | Applications Used |
| Photo Sync/Editing | Import images, edit, export | Adobe Photoshop CS6, Adobe Lightroom 4, Dropbox |
| Gaming | Download/install games, play games | Steam, Deus Ex, Skyrim, Starcraft 2, BioShock Infinite |
| Virtualization | Run/manage VM, use general apps inside VM | VirtualBox |
| General Productivity | Browse the web, manage local email, copy files, encrypt/decrypt files, backup system, download content, virus/malware scan | Chrome, IE10, Outlook, Windows 8, AxCrypt, uTorrent, AdAware |
| Video Playback | Copy and watch movies | Windows 8 |
| Application Development | Compile projects, check out code, download code samples | Visual Studio 2012 |
We are reporting two primary metrics with the Destroyer: average data rate in MB/s and average service time in microseconds. The former gives you an idea of the throughput of the drive during the time that it was running the test workload. This can be a very good indication of overall performance. What average data rate doesn't do a good job of is taking into account response time of very bursty (read: high queue depth) IO. By reporting average service time we heavily weigh latency for queued IOs. You'll note that this is a metric we've been reporting in our enterprise benchmarks for a while now. With the client tests maturing, the time was right for a little convergence.
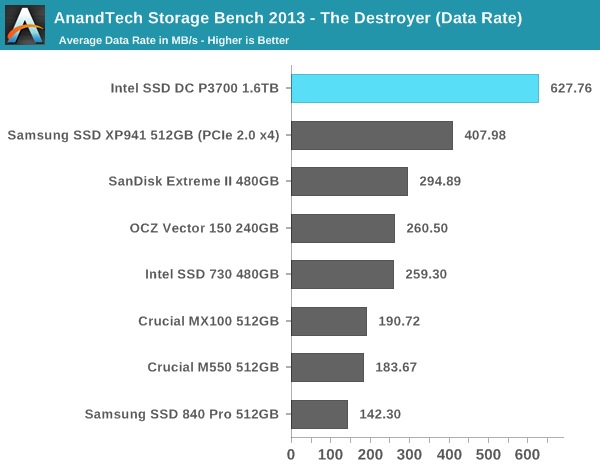
The P3700 takes the performance crown away from Samsung's XP941. Granted we are talking about a much larger and more expensive drive, but if you're after the absolute best performance for a workstation or high-end client, the P3700 is without equal.
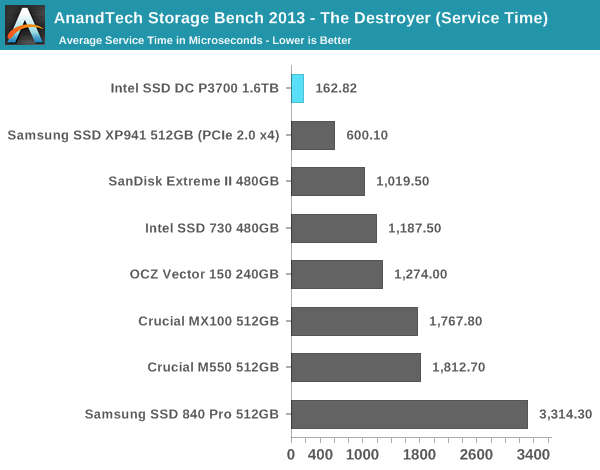
In our initial P3700 review we talked about the impact of NVMe and a lower overhead interface stack on IO latency - we see the benefits of that here in our look at average service times.
AnandTech Storage Bench 2011
Back in 2011 (which seems like so long ago now!), we introduced our AnandTech Storage Bench, a suite of benchmarks that took traces of real OS/application usage and played them back in a repeatable manner. The MOASB, officially called AnandTech Storage Bench 2011 - Heavy Workload, mainly focuses on peak IO performance and basic garbage collection routines. There is a lot of downloading and application installing that happens during the course of this test. Our thinking was that it's during application installs, file copies, downloading and multitasking with all of this that you can really notice performance differences between drives. The full description of the Heavy test can be found here, while the Light workload details are here.
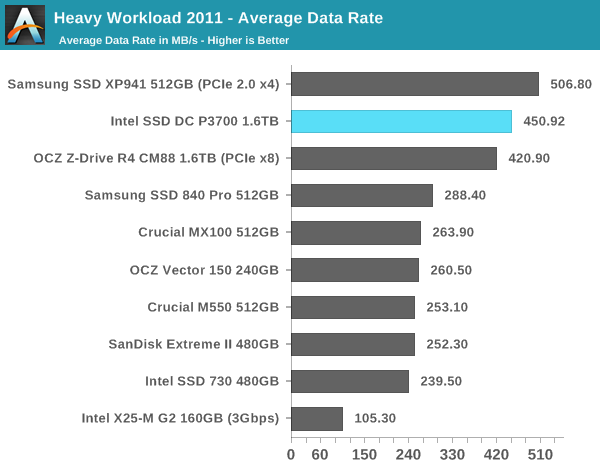
The XP941 remains the king in our 2011 heavy test. I was pretty surprised to find the P3700 lose its first place position here, but it's still competitive.
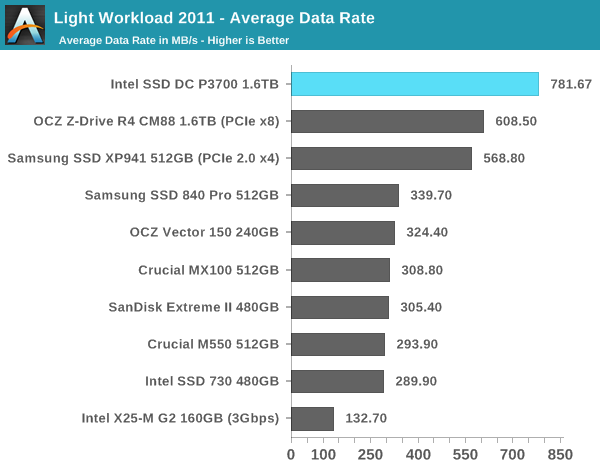
The situation reverses back to normal when we look at the light workload.


36 Comments
View All Comments
hpvd - Tuesday, June 10, 2014 - link
if OSX and Linux Boot is already possible, the Bios should already be fine !?DanNeely - Tuesday, June 10, 2014 - link
Doesn't OSX only support UEFI?xMoe - Sunday, June 15, 2014 - link
OSX on Intel supports EFI - IIRC - though Apple may have a slightly different "flavor" ... 1058 and lower support Open Firmware - if you have an old rig -if you - or anyone is interested - here is more info ---
http://en.wikipedia.org/wiki/Apple%E2%80%93Intel_a...
http://en.wikipedia.org/wiki/EFI_System_partition
http://wiki.osx86project.org/wiki/index.php/Apple&... - last updated December 02, 2011.
http://en.wikipedia.org/wiki/Extensible_Firmware_I... <- strangly this lacks any specifics on Apple tech and/or standard (or lack there of).
http://en.wikipedia.org/wiki/GUID_Partition_Table <- slightly OT - but going over drive partitions - tables MBR, GPT, etc...
althaz - Tuesday, June 10, 2014 - link
Aha, I hadn't tried it since 8.1 came out, didn't realise they'd added it :). Awesome!hpvd - Tuesday, June 10, 2014 - link
so there seem to be two differnt drivers available: one Windows included and one from Intel.Each seem to give a completly different performance for this Device:
see here: http://www.pcper.com/reviews/Storage/Intel-SSD-DC-...
(at least with the tested versions)
=> the question is: can we have both already TODAY?
Great Performance AND Boot support (using the same driver)?
hpvd - Tuesday, June 10, 2014 - link
and which driver and which version is used by anandtech for reviewing P3700?Ryan Smith - Tuesday, June 10, 2014 - link
The Intel driver. The latest (and currently only) version: 1016sorten - Tuesday, June 10, 2014 - link
I don't see any reference to OSX here:http://en.wikipedia.org/wiki/NVM_Express#Operating...
UltraWide - Tuesday, June 10, 2014 - link
The barrier to entry is the high price. Everything else is top notch.nathanddrews - Tuesday, June 10, 2014 - link
Hence, the P3600 and P3500.