Beelink GTR7 mini-PC Review: A Complete AMD Phoenix Package at 65W
by Ganesh T S on August 24, 2023 8:00 AM ESTSystem Performance: Application-Specific Workloads
Standardized benchmarks such as UL's PCMark 10 and BAPCo's SYSmark take a holistic view of the system and process a wide range of workloads to arrive at a single score. Some systems are required to excel at specific tasks - so it is often helpful to see how a computer performs in specific scenarios such as rendering, transcoding, JavaScript execution (web browsing), etc. This section presents focused benchmark numbers for specific application scenarios.
3D Rendering - CINEBENCH R23
We use CINEBENCH R23 for 3D rendering evaluation. R23 provides two benchmark modes - single threaded and multi-threaded. Evaluation of different PC configurations in both supported modes provided us the following results.
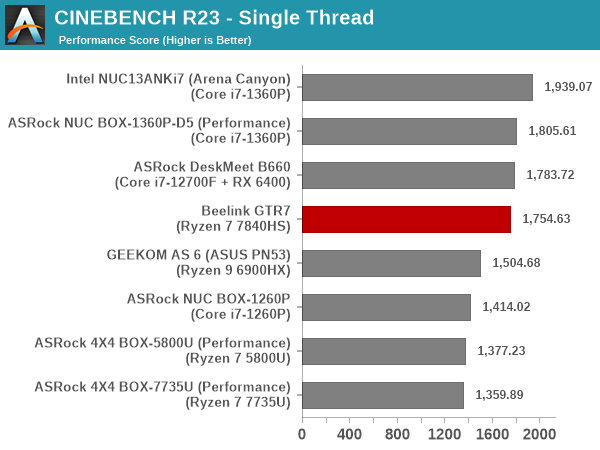
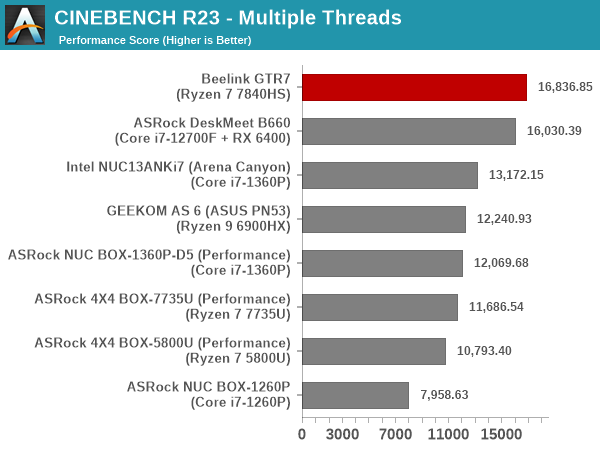
The performance in the multi-threaded case is a slam dunk for the GTR7. We see a significant improvement in the single thread scores over the Rembrandt-R systems, thanks to the higher power budget and newer microarchitecture (as well as faster RAM). However, the Raptor Lake-P NUCs seem to come away with the bragging rights for the single-threaded benchmark version.
Transcoding: Handbrake 1.5.1
Handbrake is one of the most user-friendly open source transcoding front-ends in the market. It allows users to opt for either software-based higher quality processing or hardware-based fast processing in their transcoding jobs. Our new test suite uses the 'Tears of Steel' 4K AVC video as input and transcodes it with a quality setting of 19 to create a 720p AVC stream and a 1080p HEVC stream.
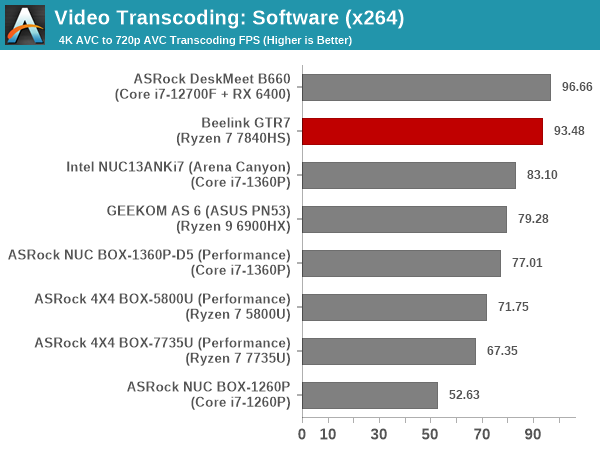
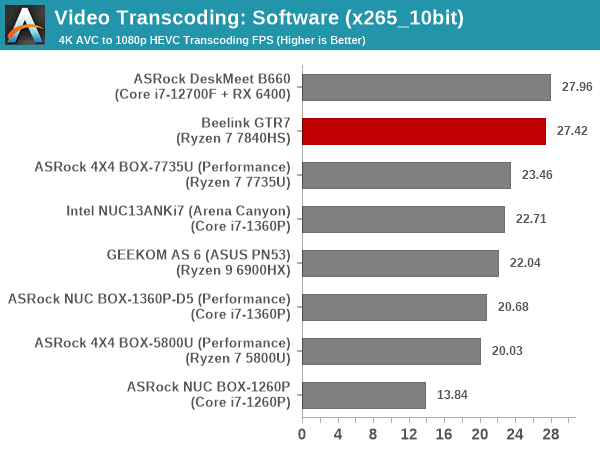
The presence of eight high-performance cores in the GTR7 gives it a very good advantage for this multi-threaded benchmark. Higher power budget translates to higher performance given that most of the systems have the same core counts. The GTR7 has a well-defined lead over other UCFF systems, and is neck-to-neck against the Alder Lake SFF PC with a dedicated 65W budget for the CPU alone.
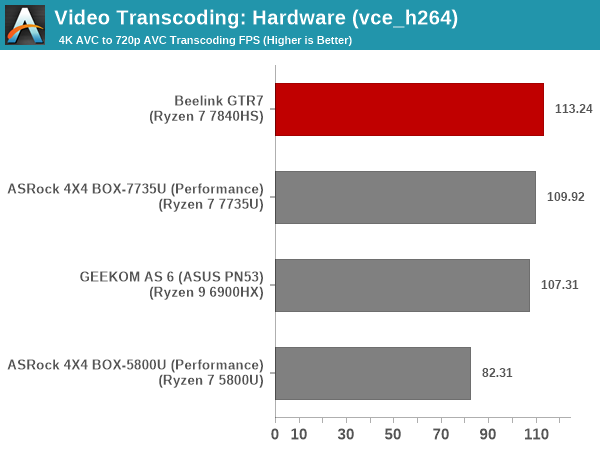
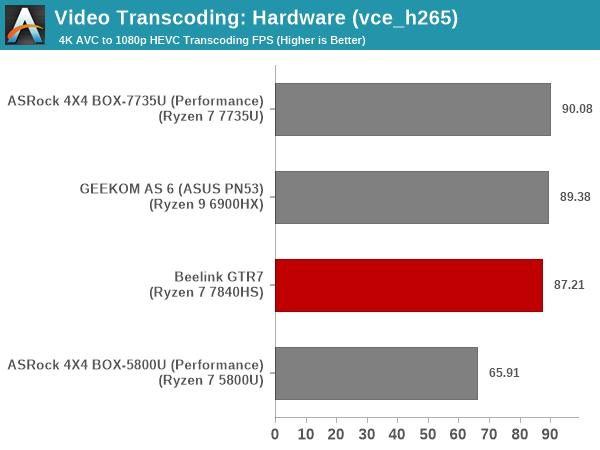
Hardware transcoding is available in the form of the VCE feature in the GPU. Intel systems have QuickSync, but a direct comparison is not advisable given that the encoding quality may differ. So, the comparison in the above graphs is restricted to AMD systems. The FPS is a function of the GPU clock rate and is directly tied to the available power budget. However, we do not find much difference in the transcoding rates between the Rembrandt-R and Phoenix systems.
Archiving: 7-Zip 21.7
The 7-Zip benchmark is carried over from our previous test suite with an update to the latest version of the open source compression / decompression software.
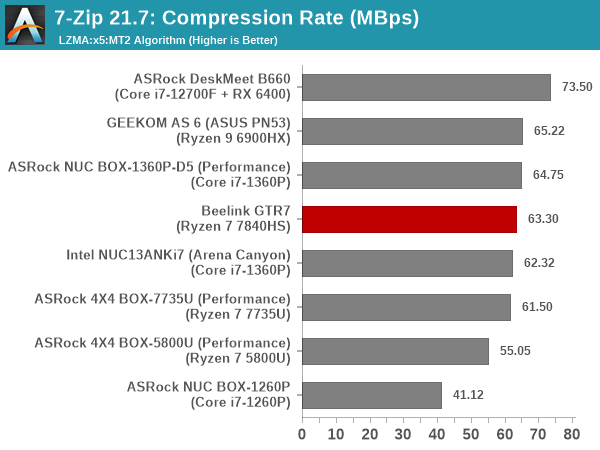
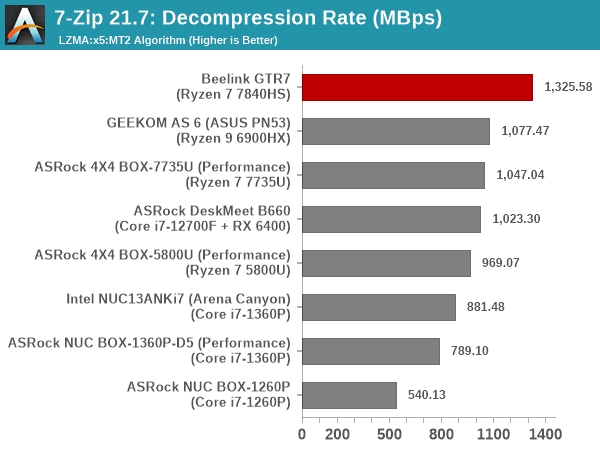
While there is not much separating the different UCFF systems in terms of compression rates, decompression is a completely different story with the 65W Phoenix system enjoying close to a 25% advantage over the 35W Rembrandt-R systems.
Web Browsing: JetStream, Speedometer, and Principled Technologies WebXPRT4
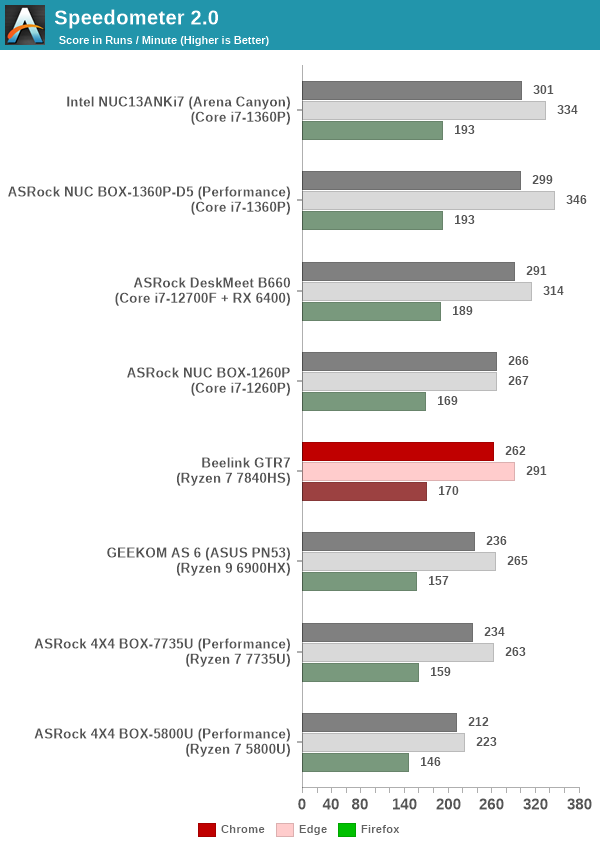
Web browser-based workloads have emerged as a major component of the typical home and business PC usage scenarios. For headless systems, many applications based on JavaScript are becoming relevant too. In order to evaluate systems for their JavaScript execution efficiency, we are carrying over the browser-focused benchmarks from the WebKit developers used in our notebook reviews. Hosted at BrowserBench, JetStream 2.0 benchmarks JavaScript and WebAssembly performance, while Speedometer measures web application responsiveness.
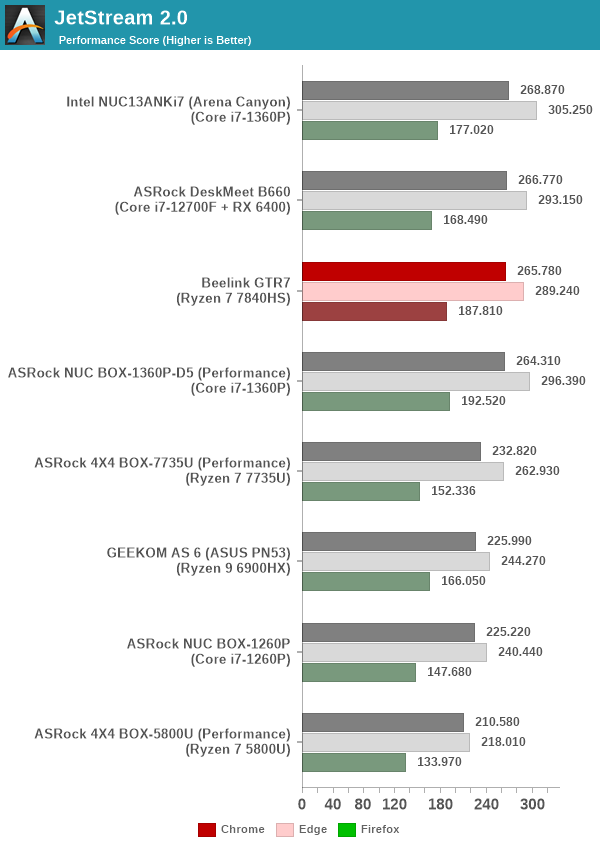
Raptor Lake-P seems to enjoy a slight advantage in single-threaded performance, and that gives the NUCs based on them an edge across all considered browsers in the JetStream 2.0 workload. The GTR7 slots in the upper half of the pack, with an improvement over the 35W Rembrandt-R systems. The same behavior is seen in the Speedometer 2.0 benchmark also.
From a real-life workload perspective, we also process WebXPRT4 from Principled Technologies. WebXPRT4 benchmarks the performance of some popular JavaScript libraries that are widely used in websites.
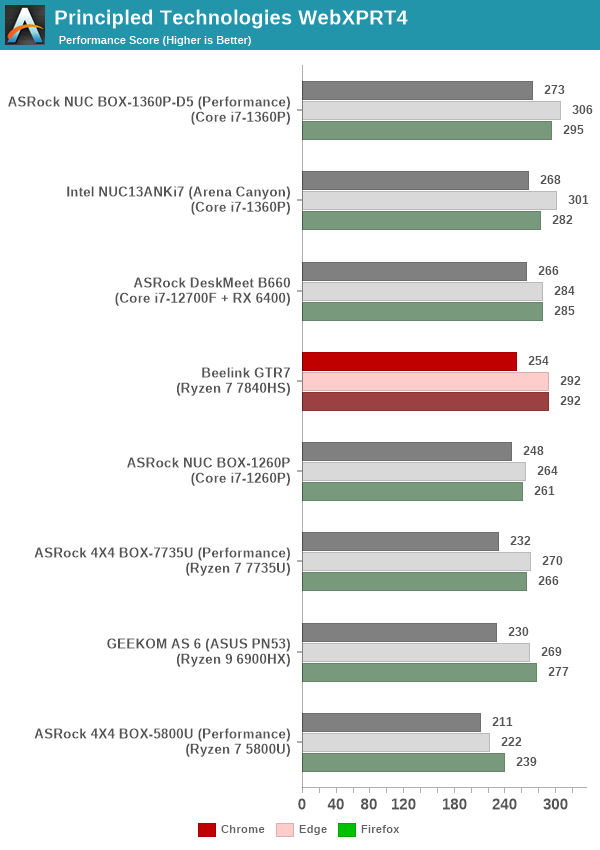
The GTR7 performs much better in this case, almost tying the ASRock Industrial NUC BOX-1360P/D5 in performance across multiple browsers. The higher power budget gives the GTR7 an edge over the considered Rembrandt-R systems. Overall, JavaScript performance seems to be primarily impacted by single-threaded performance.
Application Startup: GIMP 2.10.30
A new addition to our systems test suite is AppTimer - a benchmark that loads up a program and determines how long it takes for it to accept user inputs. We use GIMP 2.10.30 with a 50MB multi-layered xcf file as input. What we test here is the first run as well as the cached run - normally on the first time a user loads the GIMP package from a fresh install, the system has to configure a few dozen files that remain optimized on subsequent opening. For our test we delete those configured optimized files in order to force a ???fresh load??? every second time the software is run.
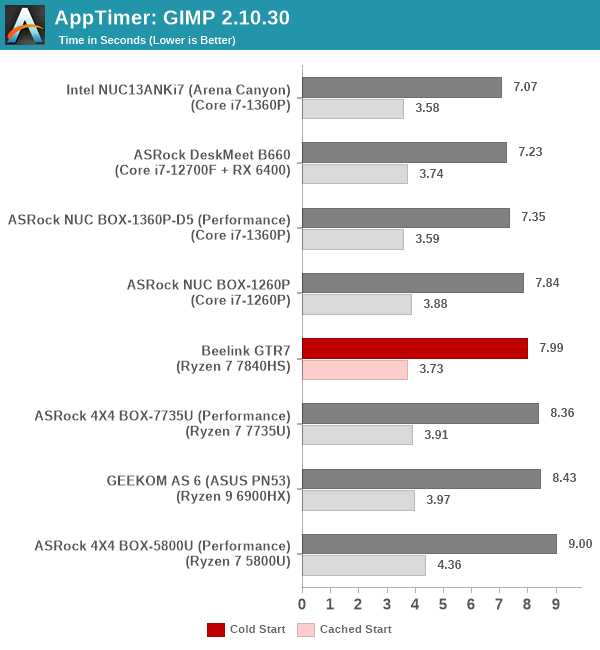
As it turns out, GIMP does optimizations for every CPU thread in the system, which requires that higher thread-count processors take a lot longer to run. So the test runs quick on systems with fewer threads, however fast cores are also needed. While the GTR7 is better than the Rembrandt-R systems on both counts, the Intel-based NUCs turn up with faster application launches under the considered conditions.
Cryptography Benchmarks
Cryptography has become an indispensable part of our interaction with computing systems. Almost all modern systems have some sort of hardware-acceleration for making cryptographic operations faster and more power efficient. In the case of IoT servers, many applications - including web server functionality and VPN - need cryptography acceleration.
BitLocker is a Windows features that encrypts entire disk volumes. While drives that offer encryption capabilities are dealt with using that feature, most legacy systems and external drives have to use the host system implementation. Windows has no direct benchmark for BitLocker. However, we cooked up a BitLocker operation sequence to determine the adeptness of the system at handling BitLocker operations. We start off with a 4.5GB RAM drive in which a 4GB VHD (virtual hard disk) is created. This VHD is then mounted, and BitLocker is enabled on the volume. Once the BitLocker encryption process gets done, BitLocker is disabled. This triggers a decryption process. The times taken to complete the encryption and decryption are recorded. This process is repeated 25 times, and the average of the last 20 iterations is graphed below.
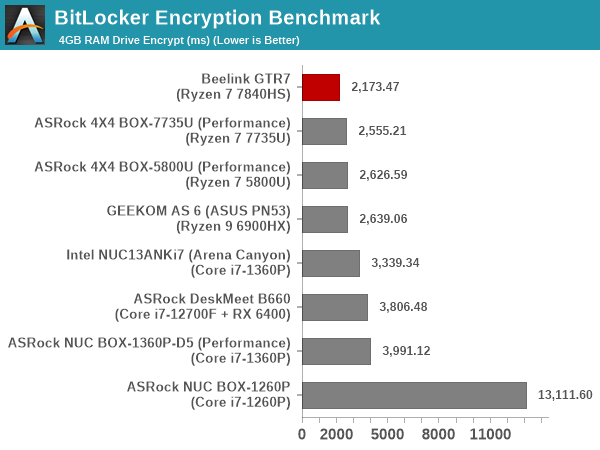
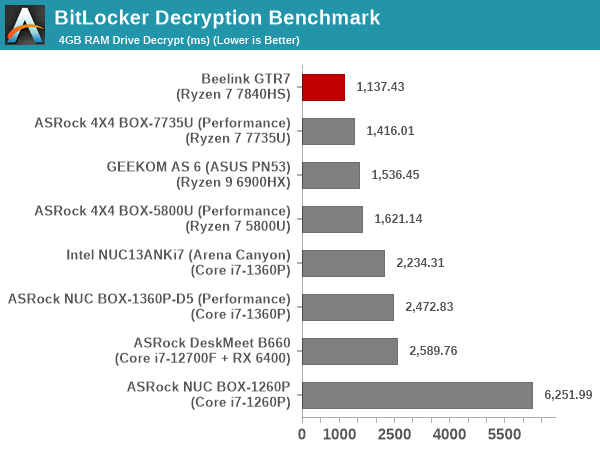
Hardware acceleration is available for the operations in all of the systems. The time taken for processing is directly dependent on the RAM speeds, available power budget, and core counts. As a result, it is no surprise that the GTR7 with DDR5-5600 RAM, 65W budget and eight high-performance cores manages to take the top spot by a comfortable margin.


56 Comments
View All Comments
ActionJ26 - Friday, August 25, 2023 - link
Go with Minisforum um790 it is $519 barebonedhaplo602 - Monday, August 28, 2023 - link
that and tested as a SteamOS platform as well ...29a - Thursday, August 24, 2023 - link
"One of the interesting aspects of the I/O ports is the presence of an audio jack in both front and rear panels. Beelink has designed this in such a way that the connection of a headset of speakers to the rear jack automatically disables the front one."Does that mean you cant output different audio streams to both, for example game audio through the speakers in the back and chat audio through headphones on the front. Most MB allow this.
ganeshts - Thursday, August 24, 2023 - link
Can you give me some MB examples that allow this? I want to check their hardware audio path.As per Beelink's user manual, the disabling of the front jack is the expected behavior when the rear jack has a connected sink.
UserZ - Thursday, August 24, 2023 - link
Disabling the front jack seems really odd. I would have a pair of speakers connected to the rear jack as the default audio. When I occasionally plug in a headset to the front, I want to use that. I would hope that you could still choose which to use without unplugging anything in case I don't like their default behavior.darkswordsman17 - Friday, August 25, 2023 - link
Yeah I think it'd be preferable for the inverse (i.e. mute the rear when the front is detected), or for it to be able to be configured so it could do mic input from one with audio output from the other. Its probably easier for them to do this though. But then there's options if you use an external audio via USB (or probably Bluetooth as well).darkswordsman17 - Friday, August 25, 2023 - link
PC motherboards use separate audio chips for front and rear ports generally, and thus its easy for Windows/games to then be configured to output different for each one. I think there might be some external gaming audio boxes that could allow this as well (headset plugged in managing just chat whilst outputting game audio to speakers), so it could come down to drivers (or maybe it auto-configures).1_rick - Thursday, August 24, 2023 - link
The Crucial isn't a bad SSD if your needs align with it's capabilities. One place it completely falls down is large writes: I copied a ~60GB game to a Beelink SEI12 from a USB-C connected SSD, rather than let it be downloaded, and the pSLC cache was exhausted pretty quickly. At that point the performance tanked to somewhere around 40MBps, down about 90% from peak speed of about 500MBps.For normal day-to-day usage, you probably won't see much of a speed penalty, though.
NextGen_Gamer - Thursday, August 24, 2023 - link
@AnandTech: Were the 3DMark Port Royal benchmarks rerun on all of the older systems? Because the DeskMeet B660 system seems way off. The Radeon RX 6400 and Radeon 680M iGPU are actually the same in specs: RDNA-2, 12 Ray Accelerators, 32 ROPs, 48 TMUs, 768 Shading Units. It should, in theory, be RX 6400 just ahead of Ryzen 9 6900HX which in turn should be just ahead of Ryzen 7 7735U. And then the latest Ryzen 7 7840HUS, with its newer and higher-clocked RDNA-3 Radeon 780M iGPU, should be on top of the charts still.ganeshts - Thursday, August 24, 2023 - link
Unlike CPU or GPU reviews, for mini-PCs, we do not update the results in every review because most of the mini-PCs are loaner samples and go back to the manufacturer.The numbers presented in the graph for the Deskmeet B660 are from January 2023, using Adrenalin GPU drivers that were the latest in December 2022. FWIW, 3DMark also has online score submissions from different users searchable at www.3dmark.com/search
For RX 6400, Port Royal overall scores range from 126 to 558 (seems to depend on the CPU also), with an average of 252
For 680M, they range from 1081 to 1415 with an average of 1026.
In the above context, the scores we have graphed (427 and 1212) are entirely plausible.
It is also possible that recent driver releases might have improved scores, but our policy for mini-PC reviews is that we carry forward the scores from the time of the original review. Every few years, we purge the database and move to the latest versions of the benchmarks and also update the OS to the latest stable (for example, we are currently using Win 11 21H2 with the latest updates, but not 22H2). At that time, we choose a set of PCs that we still have in hand, re-bench them and use the newly obtained scores with the new benchmark version / OS for comparisons starting from that point onwards.