PNY Pro Elite V2 and Elite-X PRO Portable SSDs Review: Performance on a Budget
by Ganesh T S on June 30, 2023 8:00 AM ESTPerformance Benchmarks - PNY EliteX-PRO 4 TB
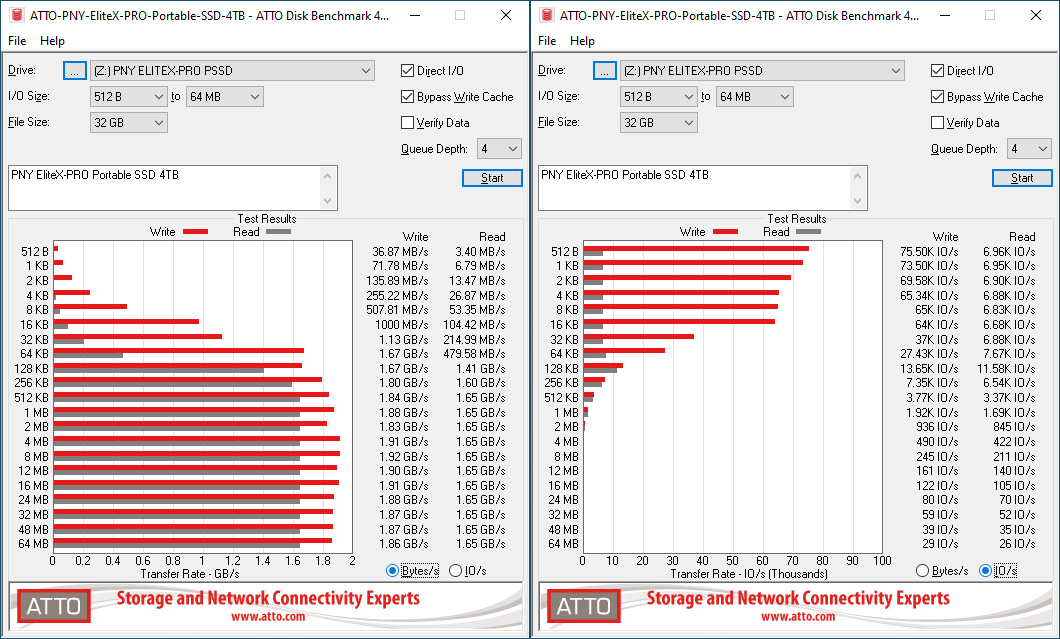
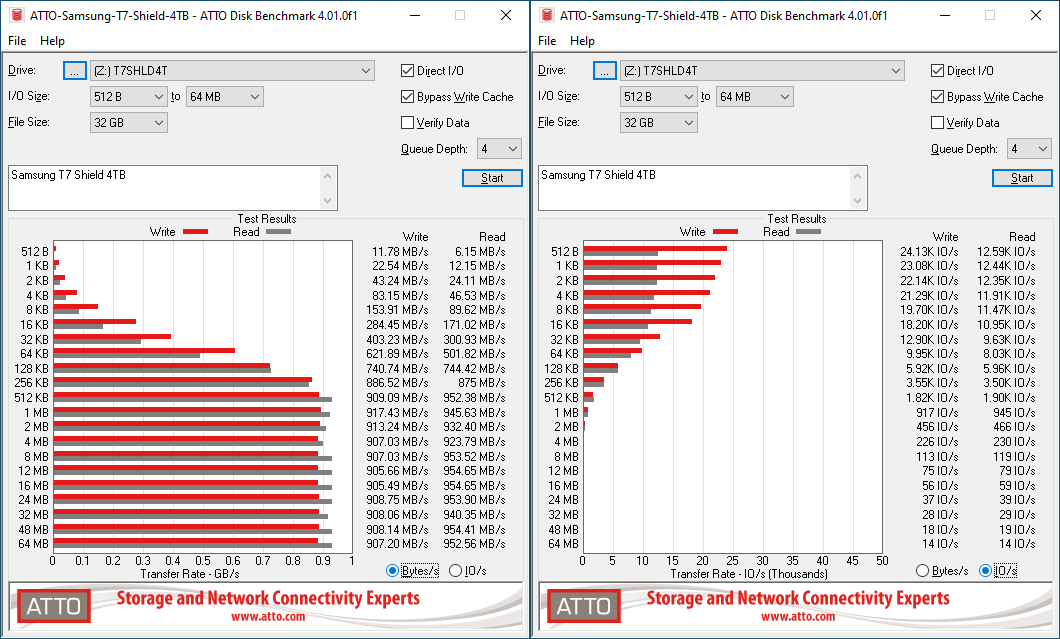
The details of the different performance benchmarks have already been covered in the previous section. Cutting right down to the chase, PNY claims read and write speeds of 1600 MBps and 1500 MBps respectively, and these are actually exceeded in the ATTO benchmarks provided below. This is only representative of a small sub-set of real-world workloads. The change in transfer rates with I/O size can be observed, and optimal performance is reached around 8 MB for a queue depth of 4.
| ATTO Benchmarks | |
| TOP: | BOTTOM: |
 |
|
 |
|
For performance comparisons, the SanDisk Extreme Pro v2 is the only other Gen 2x2 drive in the mix. It is a bridge-based solution and performs better over a range of transfer sizes compared to the EliteX-PRO.
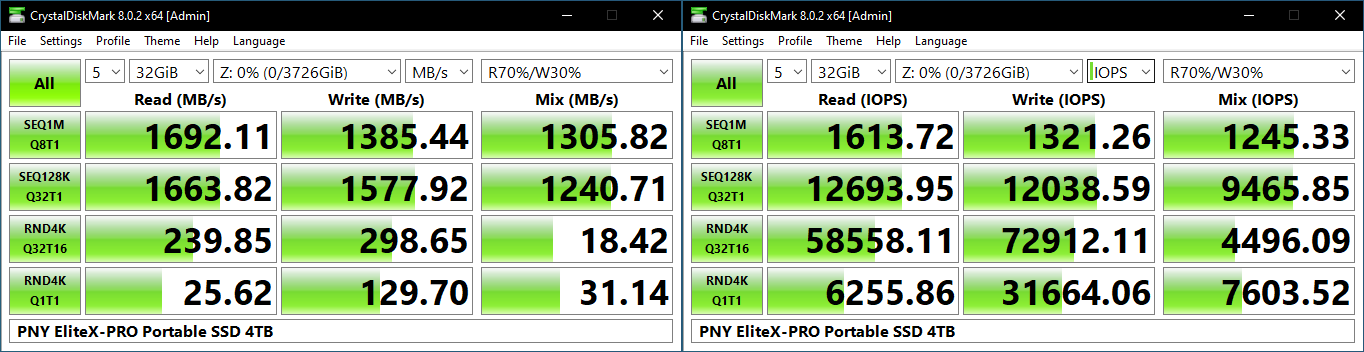
The CrystalDiskMark numbers tally with the claims from PNY - reads come in slightly south of 1700 MBps, and writes at around 1550 MBps for specific sequential workloads. Comparing the '4K Q32T16' and '4K Q1T1' numbers shows that the EliteX-PRO supports NCQ (native command queuing) / UASP (USB-attached SCSI protocol).
| CrystalDiskMark Benchmarks | |
| TOP: | BOTTOM: |
 |
|
 |
|
On the performance front, the EliteX-PRO's native UFD controller solution is no match for the bridge-based one in the SanDisk PSSD. The latter is able to hit 2 GBps in sequential accesses, and almost double the IOPS under high queue depths.
AnandTech DAS Suite - Benchmarking for Performance Consistency
Our testing methodology for storage bridges / direct-attached storage units takes into consideration the usual use-case for such devices. A description of the AnandTech DAS Suite and its components are available in the previous section.
The performance is largely along expected lines. The Gen 2x2 numbers are better than the Gen 2 numbers. The only 'surprise' is in the disk-to-disk workload, where the sustained write pressure causes the U18 to get overwhelmed and the bandwidth to go down.
Performance Consistency
Aspects influencing the performance consistency include SLC caching and thermal throttling / firmware caps on access rates to avoid overheating. This is important for power users, as the last thing that they want to see when copying over 100s of GB of data is the transfer rate going down to USB 2.0 speeds.
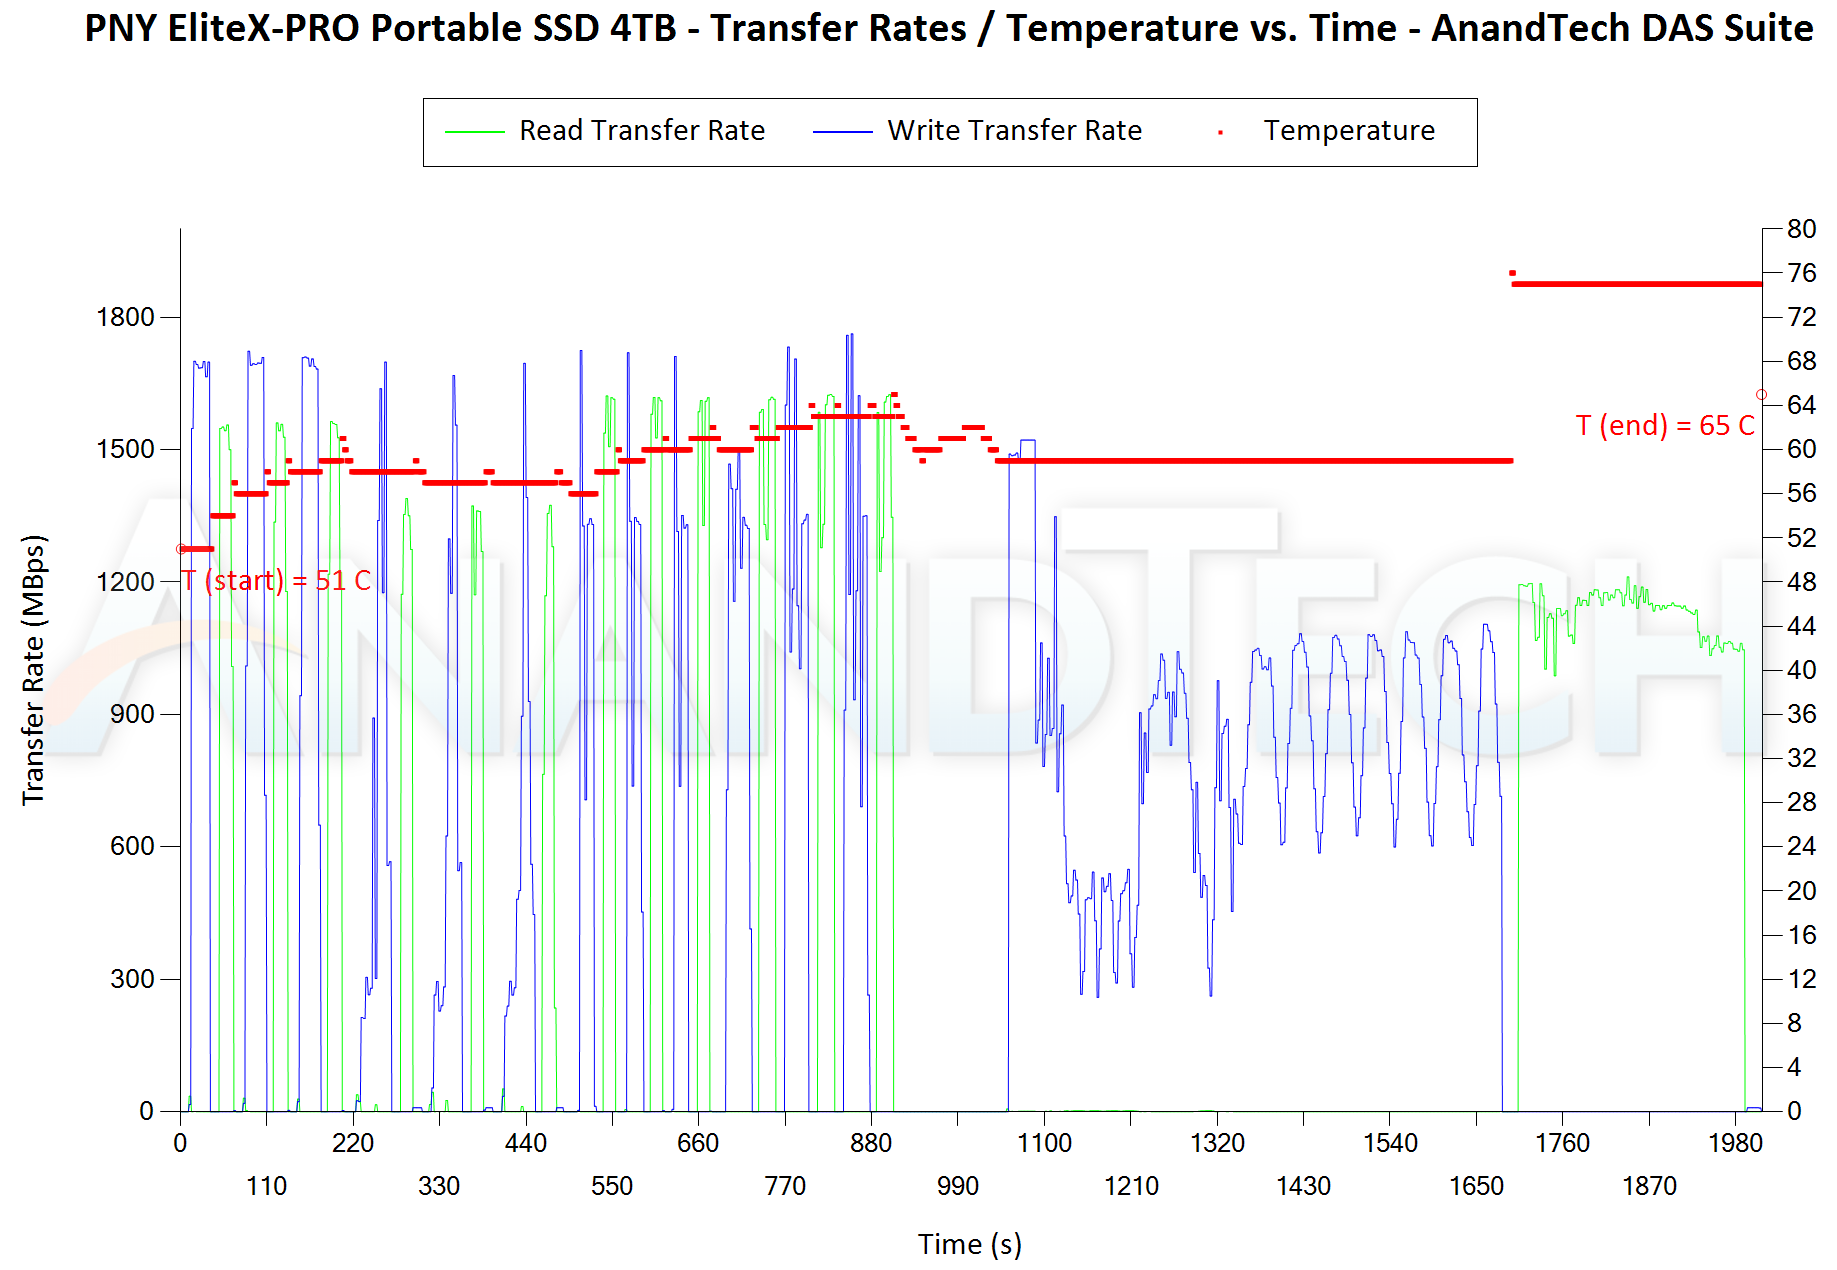
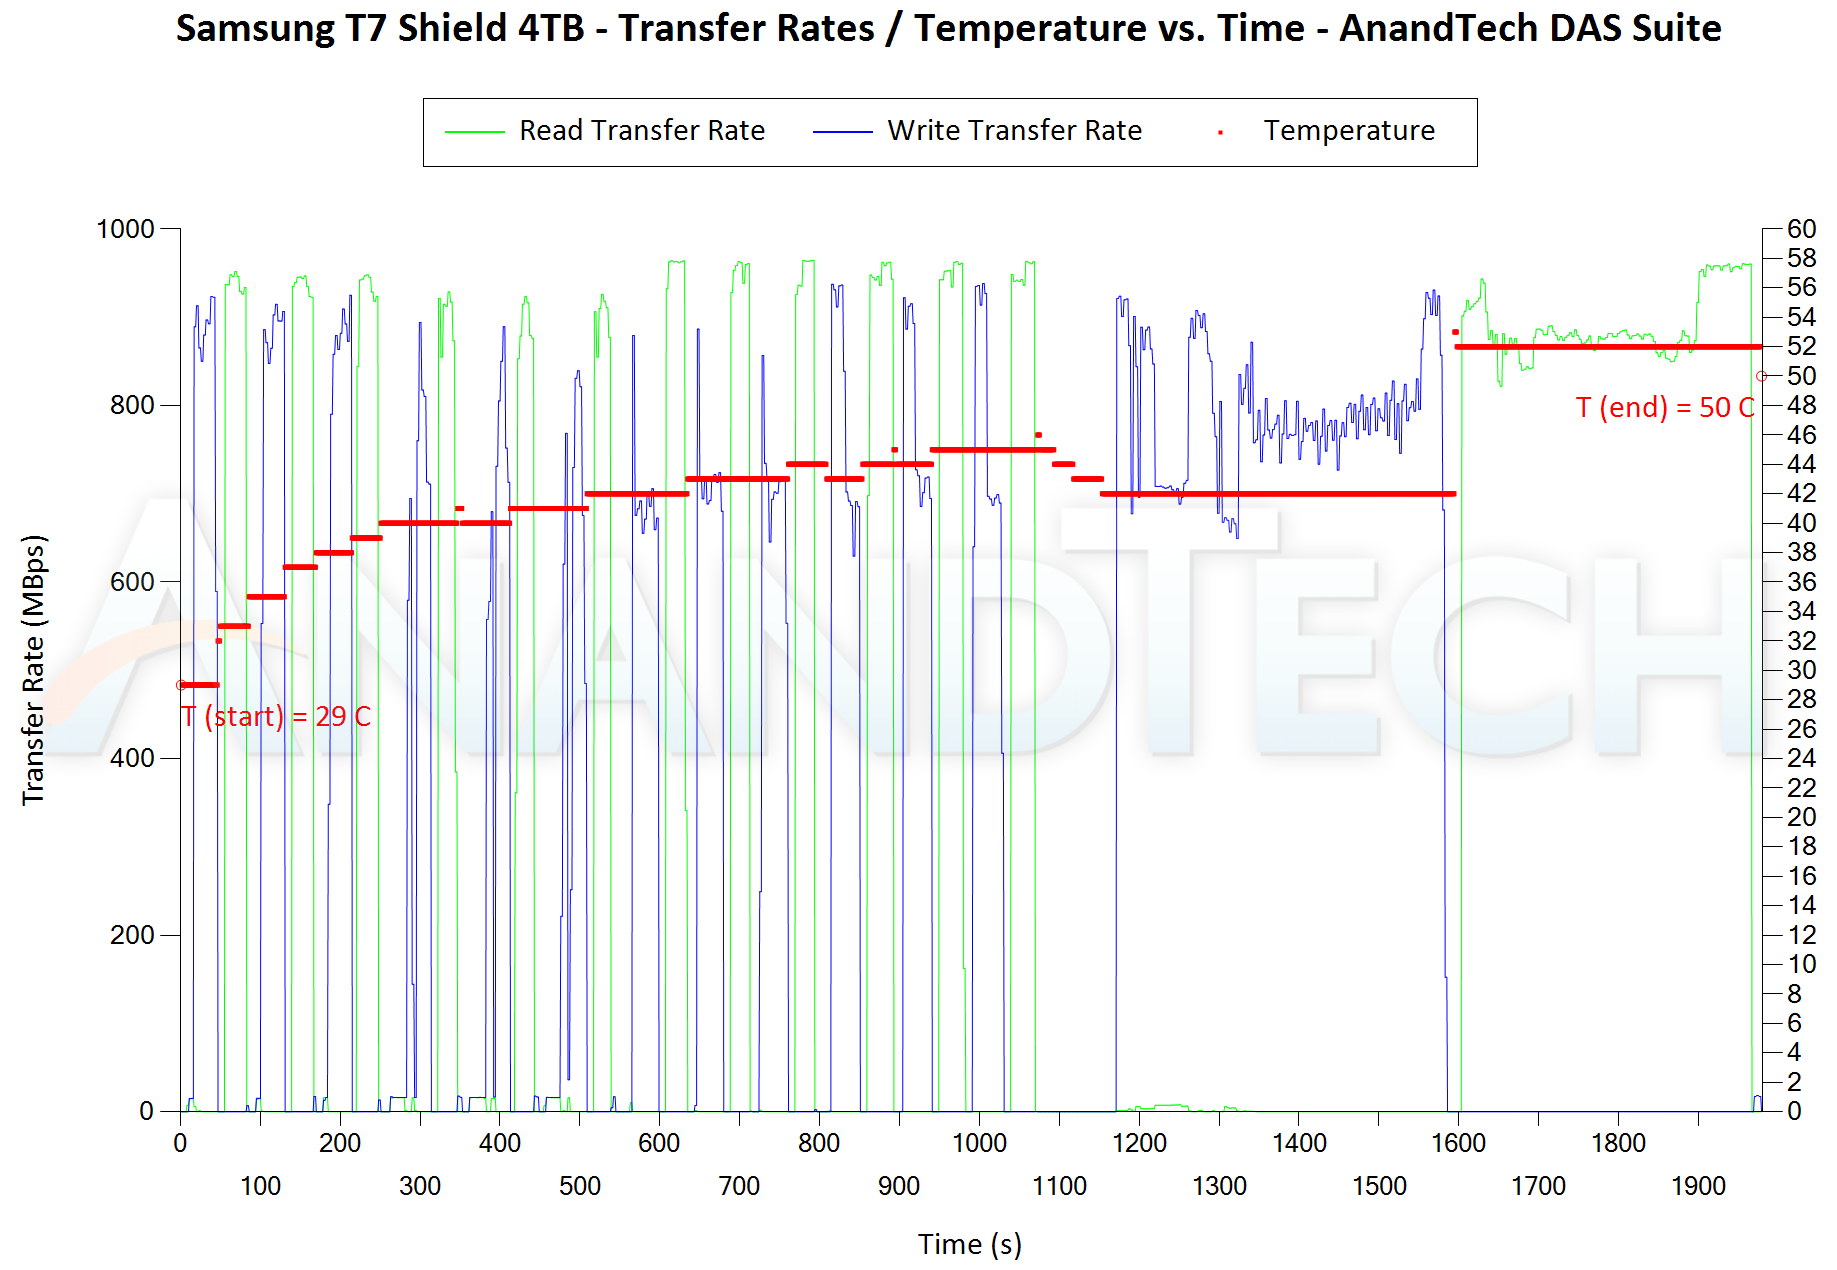
In addition to tracking the instantaneous read and write speeds of the DAS when processing the AnandTech DAS Suite, the temperature of the drive was also recorded. In earlier reviews, we used to track the temperature all through. However, we have observed that SMART read-outs for the temperature in NVMe SSDs using USB 3.2 Gen 2 bridge chips end up negatively affecting the actual transfer rates. To avoid this problem, we have restricted ourselves to recording the temperature only during the idling intervals. The graphs below present the recorded data.
| AnandTech DAS Suite - Performance Consistency | |
| TOP: | BOTTOM: |
 |
|
 |
|
The first three sets of writes and reads correspond to the AV suite. A small gap (for the transfer of the video suite from the internal SSD to the RAM drive) is followed by three sets for the Home suite. Another small RAM-drive transfer gap is followed by three sets for the Blu-ray folder. This is followed up with the large-sized ISO files set. Finally, we have the single disk-to-disk transfer set. Sustained write pressure in the last component causes thermal throttling to be hit (at the end of the writes, the temperature is 76C), but the reduction in the speed of the succeeding reads from 1.5 GBps to around 1 GBps helps in bringing the temperature down to 65C. It does appear that the EliteX-PRO could do with some more attention to the thermal design.
PCMark 10 Storage Bench - Real-World Access Traces
There are a number of storage benchmarks that can subject a device to artificial access traces by varying the mix of reads and writes, the access block sizes, and the queue depth / number of outstanding data requests. We saw results from two popular ones - ATTO, and CrystalDiskMark - in a previous section. More serious benchmarks, however, actually replicate access traces from real-world workloads to determine the suitability of a particular device for a particular workload. Real-world access traces may be used for simulating the behavior of computing activities that are limited by storage performance. Examples include booting an operating system or loading a particular game from the disk. We use PCMark 10's storage bench to evaluate PSSD performance in these types of scenarios.
Booting Windows 10
The read-write bandwidth recorded for each drive in the boo access trace is presented below.
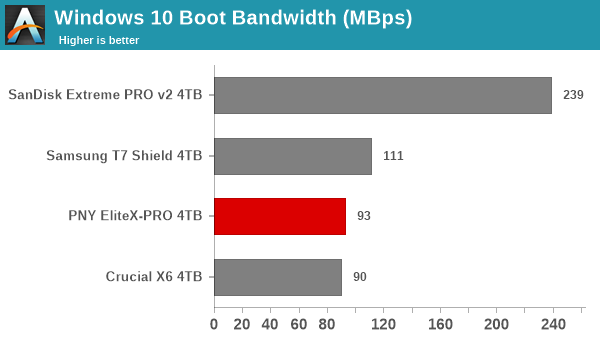
The bridge-based solutions take the lead here, with even the Gen 2 T7 Shield posting better numbers compared to the Gen 2x2 EliteX-PRO. Small random reads are better handled by a proper NVMe SSD controller rather than a native UFD controller.
Creative Workloads
The read-write bandwidth recorded for each drive in the sacr, saft, sill, spre, slig, sps, aft, exc, ill, ind, psh, and psl access traces are presented below.
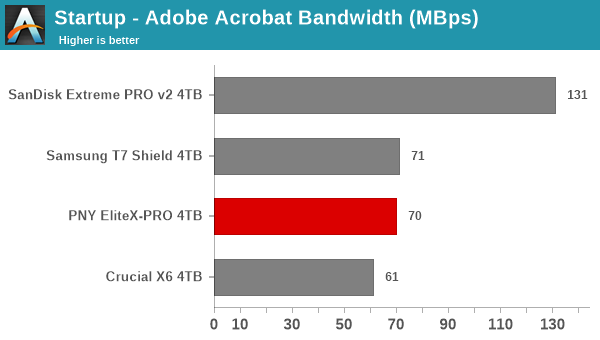
All the creative workloads see the EliteX-PRO come in either in the second or the third place. The bridge-based solutions can handle these better, but the Gen 2x2 capabilities give the PNY unit a bit of an edge over the Gen 2 T7 Shield in a few of the components.
Office Workloads
The read-write bandwidth recorded for each drive in the exc and pow access traces are presented below.
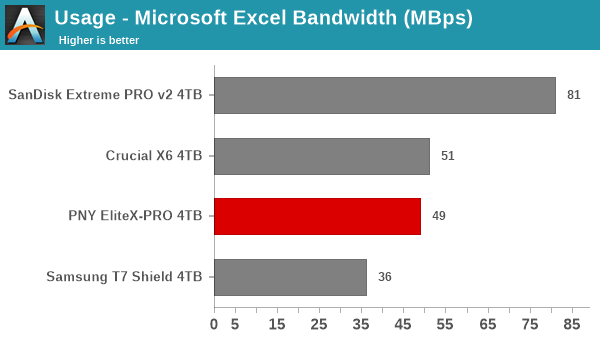
The observations made in the creative workloads sub-section above hold ture for the office workloads also. Native UFD controllers are held back in the random access performance because of the lack of DRAM, but the Gen 2x2 capabilities can sometimes give it the edge over Gen 2 bridge-based solutions like the T7 Shield.
Gaming Workloads
The read-write bandwidth recorded for each drive in the bf, cod, and ow access traces are presented below.
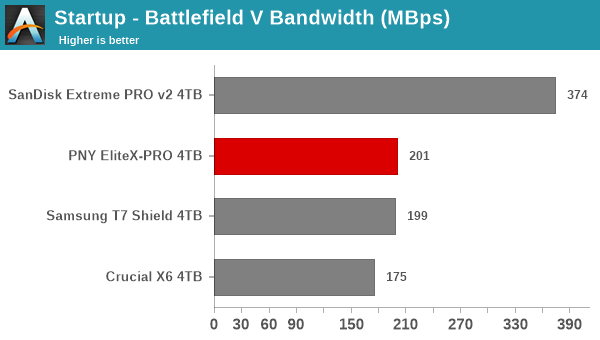
Gaming workloads are most large sequential reads with a few random accesses thrown in. It is no surprise then that the Gen 2x2 capabilities give the EliteX-PRO a slight edge over the Gen 2 T7 Shield. The SanDisk PSSD is the clear winner, though - thanks to its Gen 2x2 bridge chip.
Files Transfer Workloads
The read-write bandwidth recorded for each drive in the cp1, cp2, cp3, cps1, cps2, and cps3 access traces are presented below.
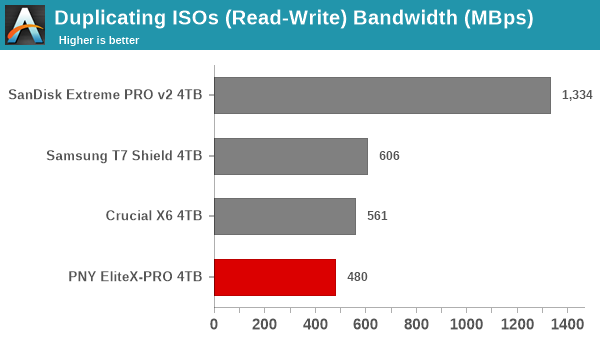
The EliteX-PRO starts off well by slotting in second (below the SanDisk Extreme PRO v2) in the ISO read component. However, the transfer rates soon start to suffer due to thermal throttling. This causes it to go below the Gen 2 T7 Shield in almost all of the other components.
Overall Scores
PCMark 10 reports an overall score based on the observed bandwidth and access times for the full workload set. The score, bandwidth, and average access latency for each of the drives are presented below.
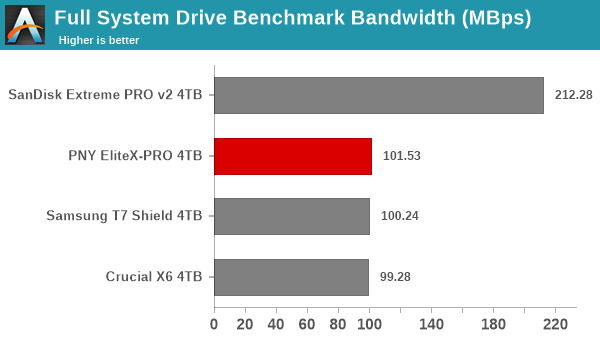
The bandwidth numbers are excellent for the EliteX-PRO despite the use of a DRAM-less native UFD controller. However, these suffer from random access performance issues, causing latencies to be much higher than bridge-based solutions. As a result, the slight edge in the bandwidth graph is not enough to prevent the PSSD from slipping to the third place behind the two bridge-based solution in the full system drive benchmark score.


4 Comments
View All Comments
garblah - Friday, June 30, 2023 - link
According to the box it supports 4K. That's good to know.But I suppose if you're designing the box art then your target audience is the average walk-in customer at Best Buy or Walmart.
PeachNCream - Tuesday, July 4, 2023 - link
To be fair, uninformed purchasing appears the norm in the US. Why else should marketing work so well on the average person if they'd done any research?evilspoons - Monday, July 10, 2023 - link
Some of your CrystalDiskMark device result screenshots are in IOPS and some are in MB/s. This makes the comparison between the OWC and Kingston 1 TB devices look incredibly lopsided on everything except the SEQ1M test.pipama09 - Wednesday, August 23, 2023 - link
hello